
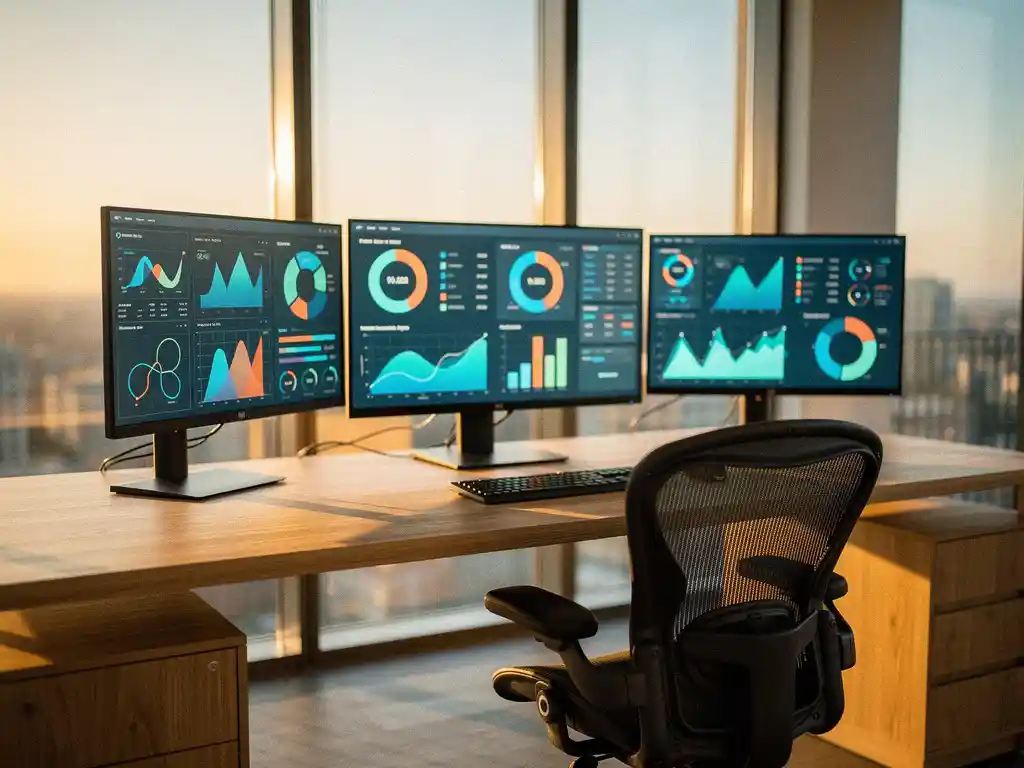
Smart office monitoring dashboards are digital command centers that transform modern offices from passive spaces into intelligent, data-driven work environments. These advanced systems collect and analyze real-time information on office performance, ranging from energy consumption and space utilization to employee satisfaction and productivity.
For organizations investing in the implementation costs of a smart office, monitoring dashboards provide essential insights that justify the return on investment. They make the difference between an expensive technological upgrade and a strategic investment that delivers measurable business results.
What are monitoring dashboards for smart office performance?
Smart office performance monitoring dashboards are integrated software platforms that collect, analyze, and visualize real-time data from all intelligent systems within an office environment. These dashboards serve as central control points where facility managers and office leaders can get a comprehensive overview of smart office performance.
These systems integrate various technologies—such as IoT sensors, smart lighting, climate control, access systems, and workspace booking—into a single, user-friendly interface. With intuitive graphs, heat maps, and real-time alerts, they provide immediate insight into how effectively the office environment is functioning. The dashboards can be customized to meet specific needs, ranging from energy efficiency to employee comfort and space optimization.
Modern monitoring dashboards often integrate with popular business software and can automatically generate reports for various stakeholders. They form the foundation for data-driven decision-making regarding office management and future investments in smart office technology.
What metrics can monitoring dashboards track in a smart office?
Smart office monitoring dashboards can track a wide range of performance metrics, from operational efficiency to employee well-being. Key performance metrics include energy consumption, space utilization, air quality, temperature, lighting, noise levels, workspace occupancy, and employee movement patterns.
In terms of energy management, these systems track the energy consumption of lighting, air conditioning, heating, and electronic equipment by zone or even by workstation. They can automatically detect inefficiencies and suggest ways to optimize performance. Space utilization is measured using sensors that detect which meeting rooms, workstations, and common areas are actually in use.
Air quality measurements include CO2 levels, humidity, and the presence of pollutants. This data helps optimize ventilation systems and create a healthier work environment. Acoustic measurements monitor noise levels to ensure productivity and concentration.
Advanced dashboards can also analyze employee behavior, such as movement patterns throughout the office, the popularity of different zones, and the effectiveness of flexible workspaces. These insights inform decisions regarding office layout and facility amenities.
How do office performance monitoring dashboards work?
Office performance monitoring dashboards utilize a network of IoT sensors and smart devices that continuously collect data, send this information to a central database where algorithms analyze it, and then present real-time visualizations and insights through user-friendly interfaces.
The process begins with data collection using various types of sensors: motion sensors detect presence and occupancy, temperature and humidity sensors monitor environmental conditions, and energy meters track power consumption. These sensors communicate wirelessly with a central system via protocols such as Wi-Fi, Zigbee, or LoRaWAN.
The collected raw data is then processed by analytical software that recognizes patterns, identifies trends, and detects anomalies. Machine learning algorithms can make predictions about future usage and automatically suggest optimizations. For example, the system can predict when a meeting room will become available or which areas need additional heating.
The processed information is presented via dashboards accessible through web browsers or mobile apps. Users can view real-time data, analyze historical trends, and generate custom reports. Automatic alerts notify administrators of issues, such as high CO2 levels or unusual energy spikes.
What are the benefits of monitoring dashboards for office management?
Office management monitoring dashboards offer significant benefits, including cost savings through energy efficiency, improved employee satisfaction through optimal working conditions, data-driven decision-making for space planning, and proactive maintenance that prevents costly repairs.
Cost savings are achieved through intelligent energy optimization. Dashboards can automatically adjust lighting and climate control based on occupancy, which can result in energy savings of up to 30–40%. By gaining insight into actual space utilization, organizations can optimize their real estate strategy and potentially reduce office space.
Employee comfort is enhanced because the system automatically optimizes temperature, lighting, and air quality. This leads to higher productivity and lower absenteeism. Flexible workspace booking is streamlined, eliminating frustration over occupied spaces.
For facility managers, the dashboards provide unprecedented insight into office performance. They can identify trends, detect issues early on, and make informed decisions about investments and adjustments. Predictive maintenance prevents unexpected breakdowns by providing early warnings about equipment that requires maintenance.
What technology do monitoring dashboards for smart offices require?
Smart office monitoring dashboards require an integrated technology ecosystem consisting of IoT sensors, wireless communication networks, cloud-based data processing, analytical software, and user interfaces. These components work together to create a seamless monitoring and management experience.
The foundation is made up of various types of sensors: occupancy sensors for presence detection, environmental sensors for temperature and air quality, energy meters for consumption monitoring, and smart meters for water and gas. These sensors must be compatible with standard communication protocols such as Wi-Fi, Bluetooth, Zigbee, or LoRaWAN.
A robust network infrastructure is essential for reliable data communication. This often involves a combination of wired and wireless connections, with redundancy for critical systems. Cloud platforms provide the processing power needed for big data analytics and machine learning algorithms that recognize patterns and make predictions.
The software architecture consists of database systems for data storage, analytical engines for data processing, and APIs for integration with existing business systems. User interfaces must be responsive and accessible across various devices, from desktop computers to smartphones and tablets.
How Wout Monseurs Helps with Smart Office Monitoring Dashboards
We offer comprehensive smart office solutions that seamlessly integrate monitoring dashboards into your office environment. With over 60 years of experience in office design, we combine traditional expertise with cutting-edge technology to create intelligent work environments that deliver measurable results.
Our smart office implementation includes:
- Comprehensive analysis of your current office environment and needs
- Custom monitoring dashboards tailored to your specific goals
- Integration with existing systems and office layout
- Training and support for optimal use of the dashboards
- Continuous monitoring and optimization of system performance
As a family-owned business based in Breda, we understand that every organization faces unique challenges. That’s why we offer personalized support throughout the entire implementation process, from the initial consultation to final delivery. Contact us for a no-obligation consultation on how monitoring dashboards can transform your firm’s performance.
Frequently asked questions
How long does it take to fully implement a monitoring dashboard for a smart office?
The implementation time ranges from 4 to 12 weeks, depending on the size of your office and the complexity of the desired integrations. A standard office of 500–1,000 square meters can usually be fully operational within 6–8 weeks, including sensor installation, software configuration, and employee training.
What happens if the internet goes down—will the monitoring dashboard still work?
Modern smart office dashboards have local backup systems that continue to perform essential functions such as climate control and access control. Data is stored locally and automatically synchronized once the internet connection is restored. Critical alerts can be sent via SMS or other offline channels.
Can security dashboards integrate with our existing HR and facility management software?
Yes, most professional monitoring dashboards offer API integrations with popular business software such as SAP, Microsoft 365, ServiceNow, and various HR systems. This ensures seamless data exchange and eliminates duplicate work when managing workspace bookings and facility requests.
How accurate are the measurements on monitoring dashboards, and how often are they updated?
Professional IoT sensors have an accuracy of 95–99% and typically update every 1–5 minutes, depending on the type of measurement. Critical parameters such as air quality and temperature are measured more frequently than occupancy data. The dashboards display real-time data with a maximum delay of 30 seconds.
What are the monthly operating costs of a monitoring dashboard after implementation?
Monthly costs range from €2 to €8 per workstation, depending on the number of sensors and desired features. This includes cloud hosting, software licenses, data storage, and basic support. Most organizations recoup these costs through energy and space savings within 12 to 18 months.
How is employee privacy protected when using monitoring dashboards?
Privacy is ensured through anonymous data processing—the system detects presence but does not identify individual users. All data is stored in encrypted form and complies with GDPR regulations. Employees can clearly see what data is being collected and have control over personal preferences, such as temperature settings.
What should I do if the dashboard displays unexpected warnings or unusual data?
Start by checking the sensors in the affected zone for physical obstructions or damage. The dashboard usually includes a troubleshooting section with common solutions. For more complex issues, suppliers such as Wout Monseurs offer remote support and can often diagnose the problem within 24 hours using the system itself.